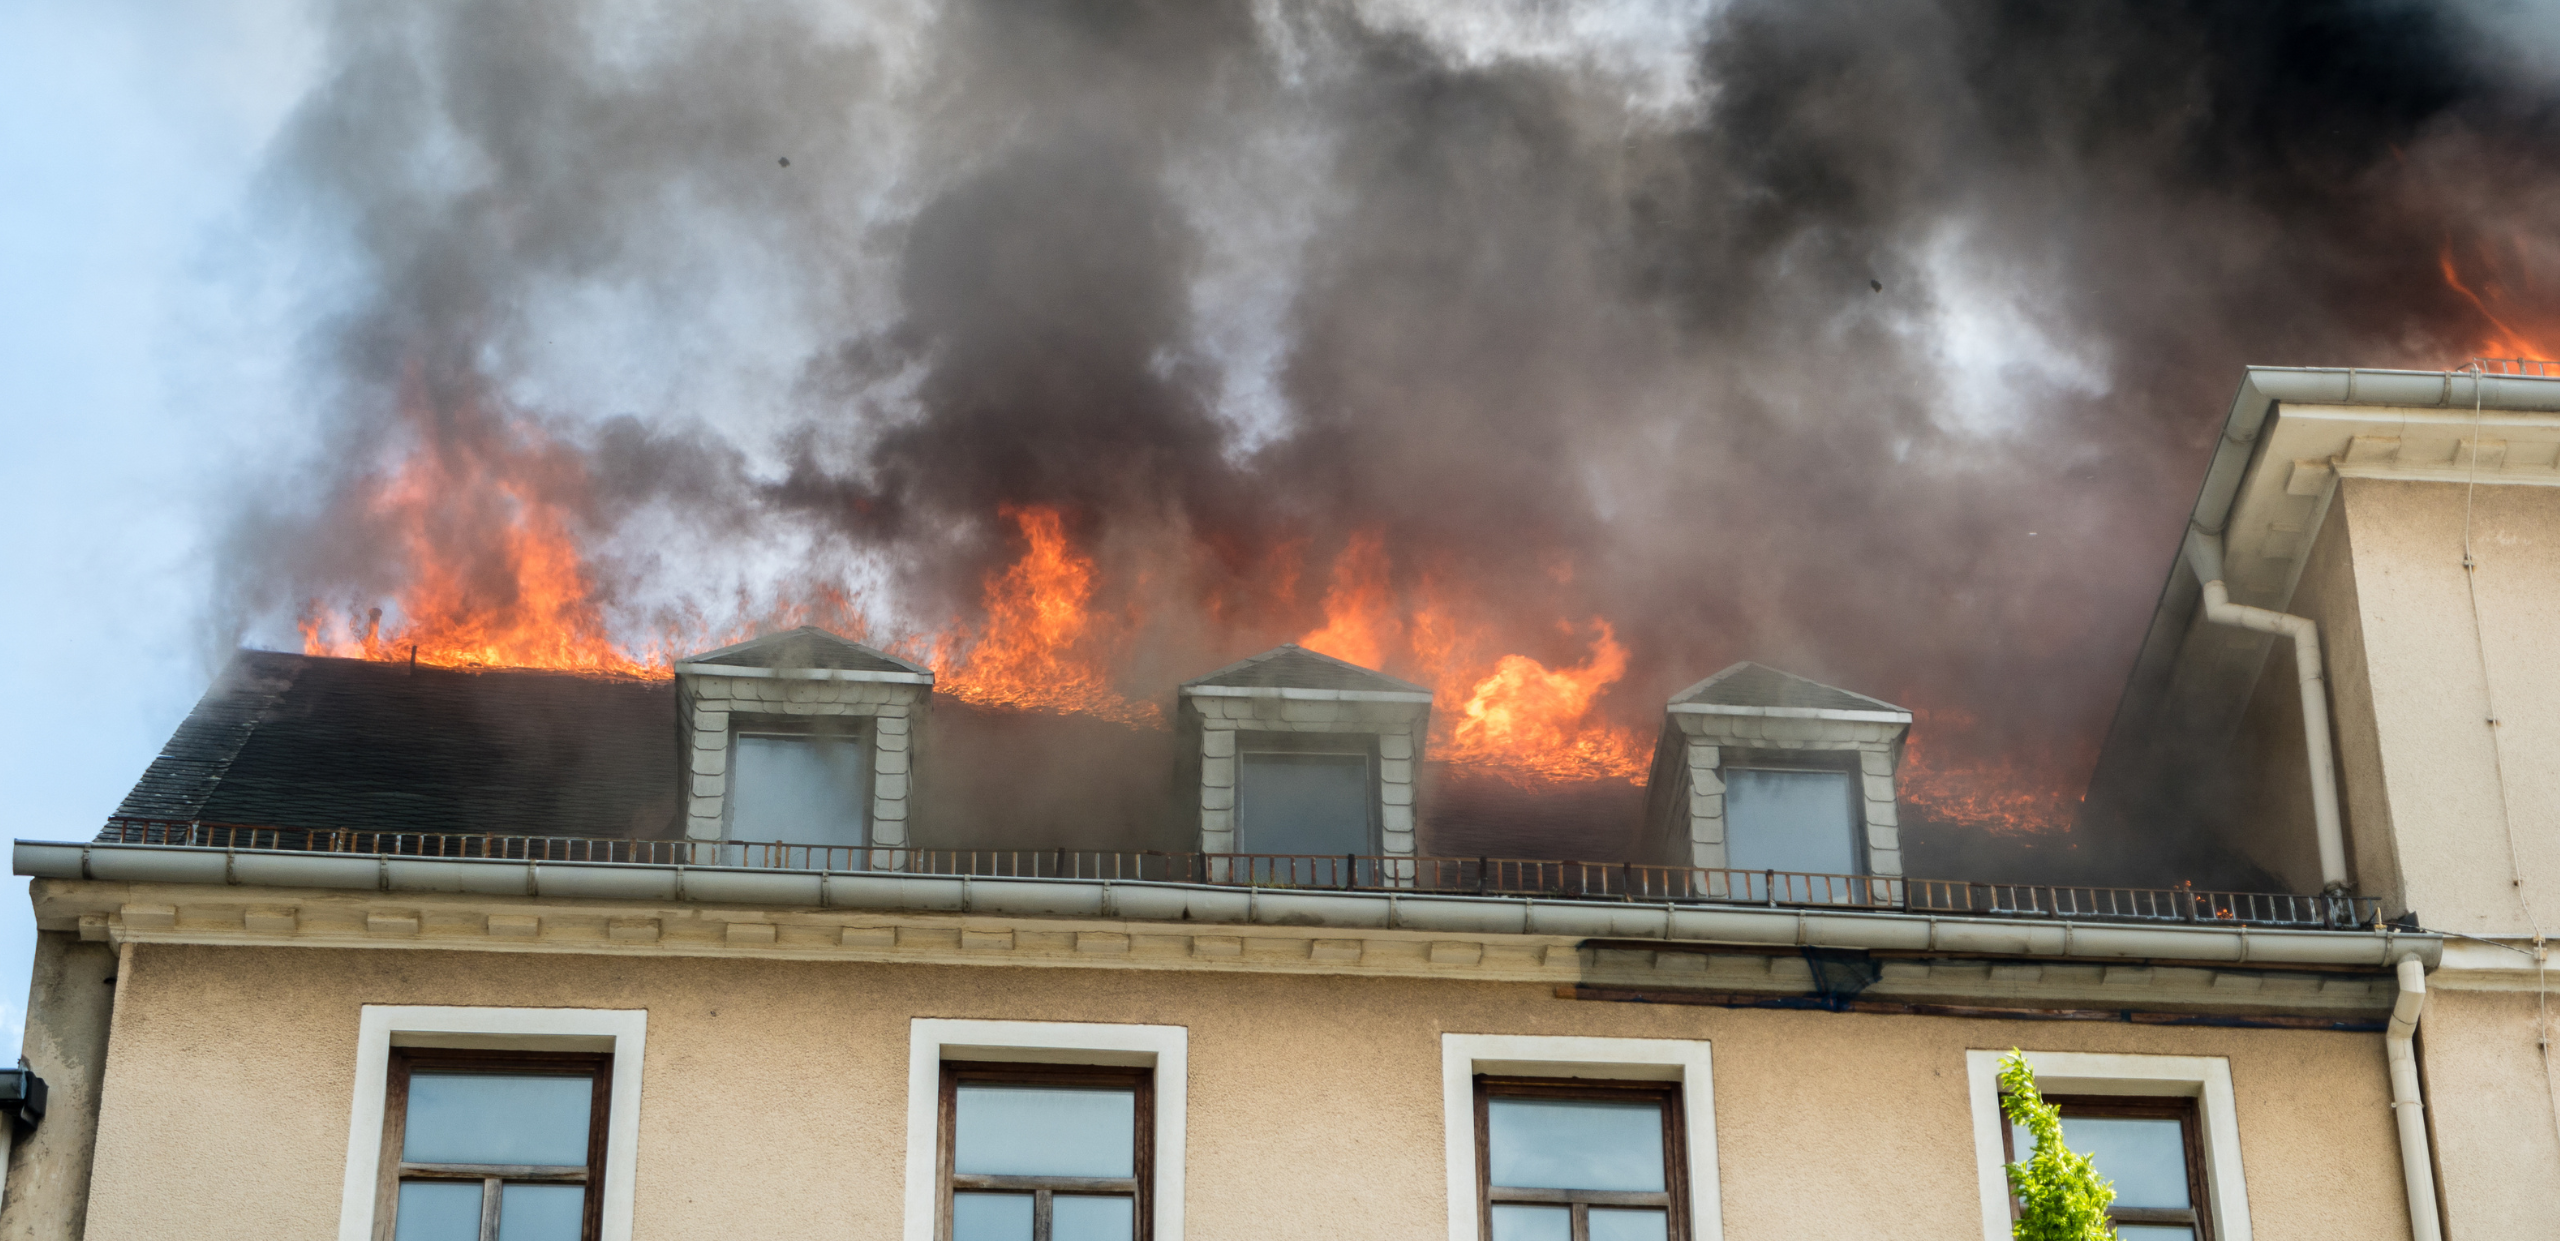
Between 2010 and 2025, the UK Fire & Rescue Services attended over 451,078 dwelling fires, spanning houses, flats, caravans, and other dwellings, excluding hotels, hostels, and care facilities. This analysis of English home fire statistics highlights clear patterns in risk and damage, offering valuable insights for insurers, policymakers, and communities.
While most incidents resulted in relatively small areas of damage, a proportion escalated into large-scale events, particularly in homes without working fire alarms, during night-time hours, or in properties with vulnerable construction types such as thatch or timber.
This report explores damage trends, geographic variations, and the critical role of alarms and building type in house fires in England.
Damage Extent in House Fires
Damage from a home fire can result from flames, heat, smoke, or even the methods used to extinguish the blaze – for example, water or other substances used to put out the fire, or walls or windows damaged to facilitate the evacuation of casualties. This analysis focuses on total damage from all sources, not solely fire damage.
Fires vary dramatically in how much damage they cause. The vast majority of residential fires are contained quickly, resulting in damage under 5 square metres, often limited to one appliance, item of furniture, or room.
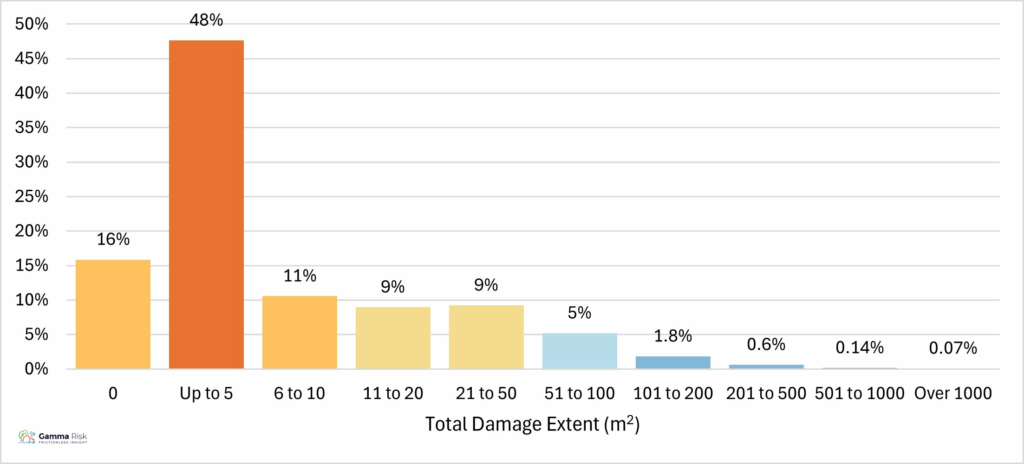
Chart 1: Damage Extent in House Fires, 2010/11 – 2024/25
For analysis purposes, average damage estimates are based on midpoint calculations for intervals up to 1,000 square metres. The dataset includes 450,772 fires (99.93%) where damage remained below this threshold.
DAMAGE_EXTENT | Assumed extent of damage (square metres) |
0 | 0 |
Up to 5 | 3 |
6 to 10 | 8 |
11 to 20 | 15 |
21 to 50 | 35 |
51 to 100 | 75 |
101 to 200 | 150 |
201 to 500 | 350 |
501 to 1000 | 750 |
Geographic Trends
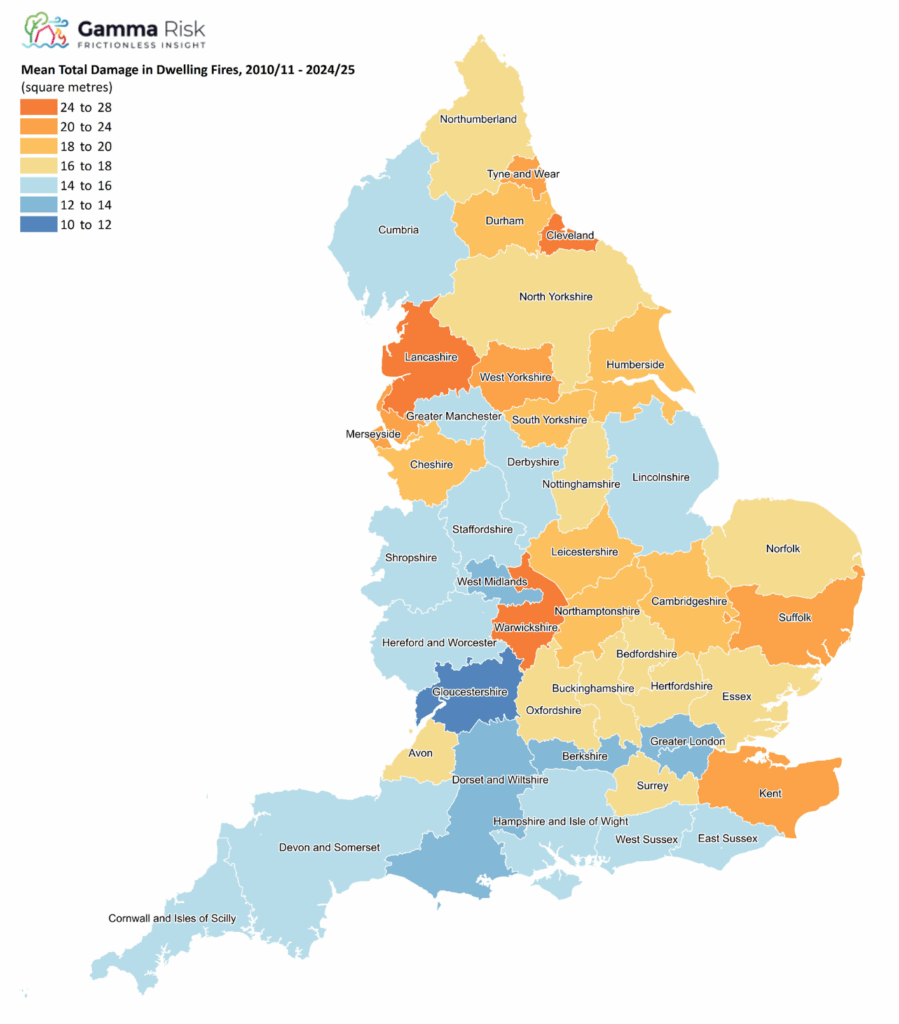
England is divided into 43 Fire & Rescue Services (FRS) Territories. Gloucestershire FRS Territory had the smallest average total damage at just 10.3 square metres, while Cleveland FRS had the highest average total damage at 27.5 square metres. These differences highlight regional disparities in house fires in England.
Fire Damage Is Decreasing Over Time
Across 15 years of reporting, there is a positive long-term trend: the average area damaged per home fire has decreased from 21 sqm in 2010/11 to 14 sqm in 2024/25. This downward trend may reflect several societal and policy-driven improvements:
- Wider adoption of fire alarms and smoke detection systems: 92% of households reported having at least one working smoke alarm in 2023/24 compared to 86% in 2010/11
- Increased public awareness and education
- Better building regulations and materials
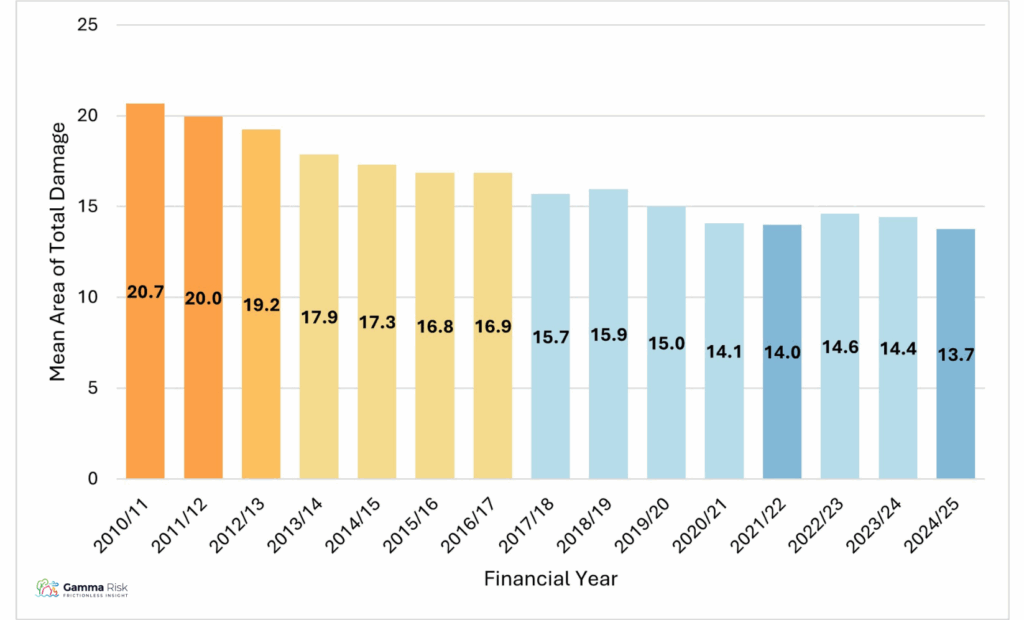
Chart 2: Average Area Damaged in House Fires per Year
The Role of Time
From 2017/2018 onwards, the data reveals that night-time dwelling fires are more destructive, averaging just over 20 square metres compared to the overall average of 16.
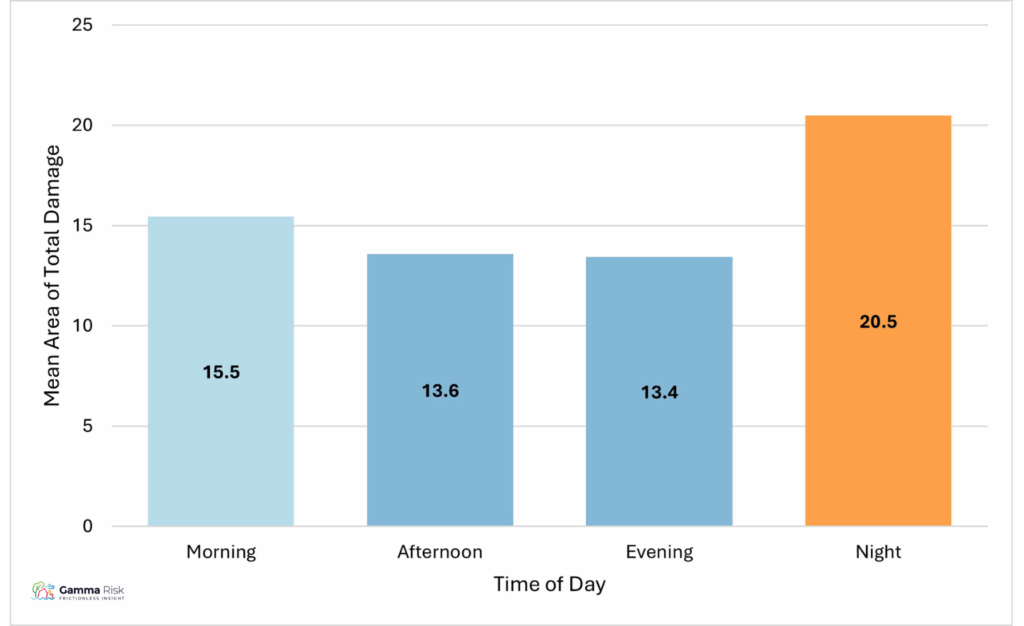
Chart 3: Total Damage in House Fires by Time of Day, 2017/18 – 2024/25
Fires discovered immediately caused an average of only 7.5 square metres’ damage, compared to 32 square metres when discovery occurred more than 30 minutes after ignition.
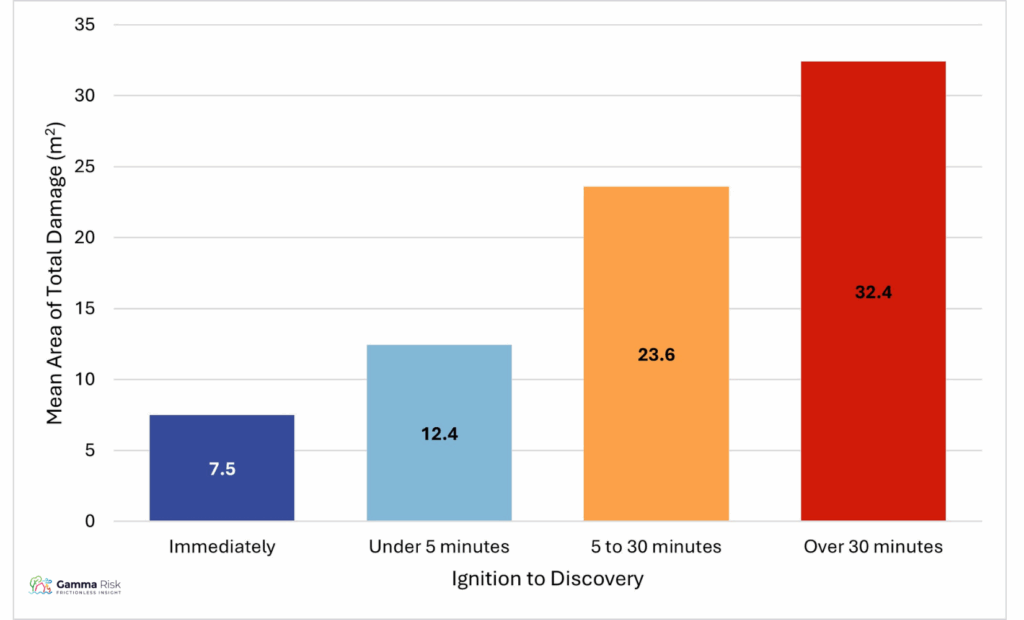
Chart 4: Time from Ignition to Discovery and Total Damage in House Fires, 2010/11 – 2024/25
An additional insight comes from how quickly emergency services are contacted once a fire is discovered. Up to 30 minutes, longer delays steadily increase the average damage. Interestingly, when the time to call exceeds 30 minutes, average damage actually drops off, suggesting these may represent smaller fires or cases resolved before escalation.
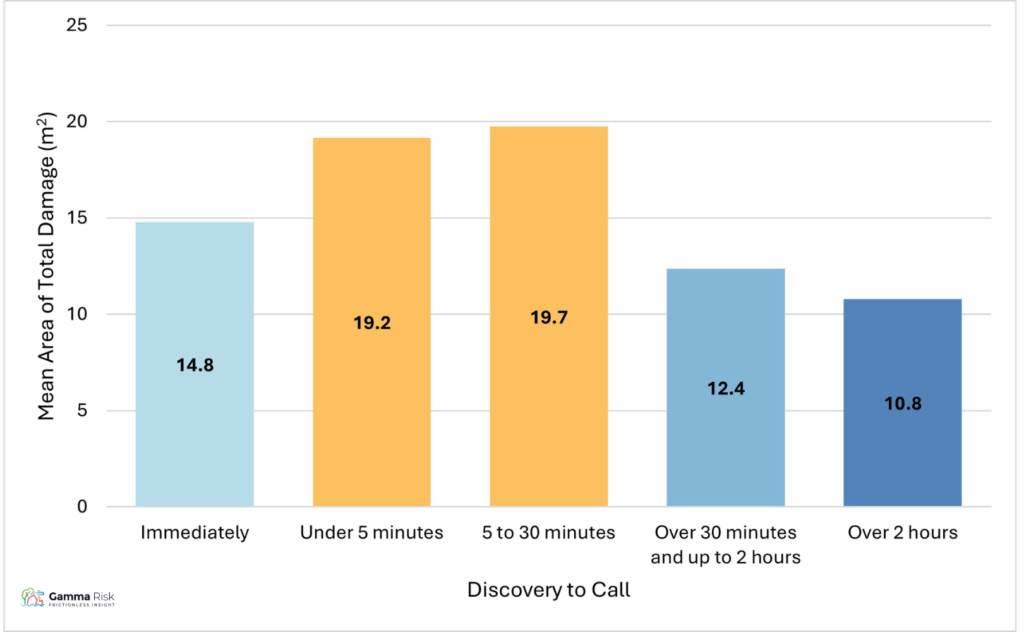
Chart 5: Time from Discovery to Call vs Average Damage in House Fires 2010/11 – 2024/25
Although median fire service response times were between six and seven minutes, longer delays correlated with greater damage. Only 4% of incidents exceeded a 15-minute response time, but these resulted in disproportionately higher damage.
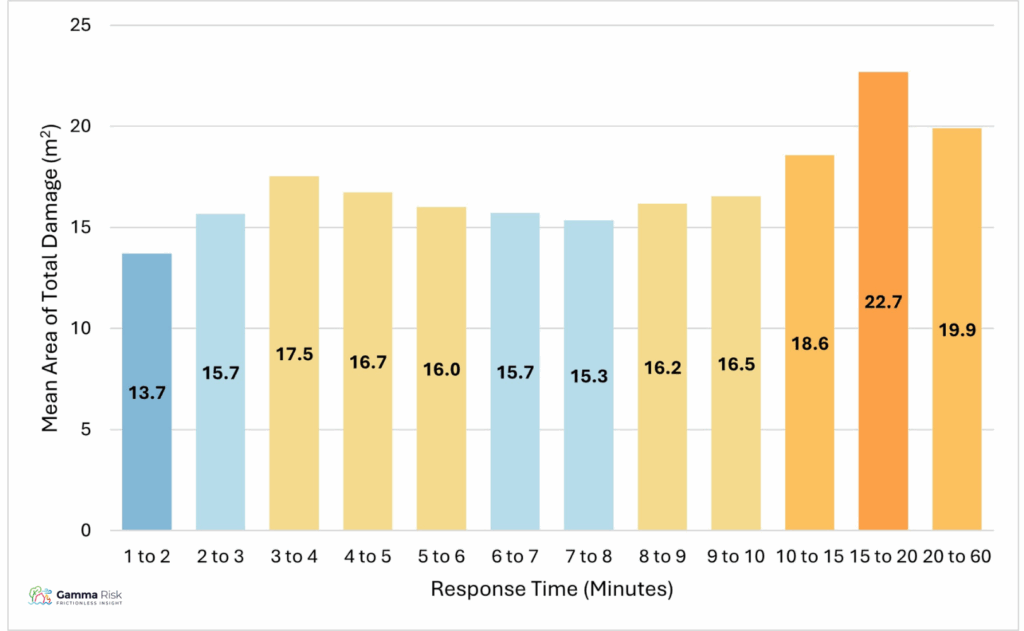
Chart 6: Response Time vs Average Damage in House Fires 2010/11 – 2024/25
Risk by House Type & Occupancy
Some buildings are more vulnerable than others. Multiple-occupancy houses, such as subdivided flats or shared housing, recorded the highest average damage at nearly 20 square metres.
By contrast, purpose-built low-rise houses demonstrated greater resilience, averaging 12.8 square metres of damage.
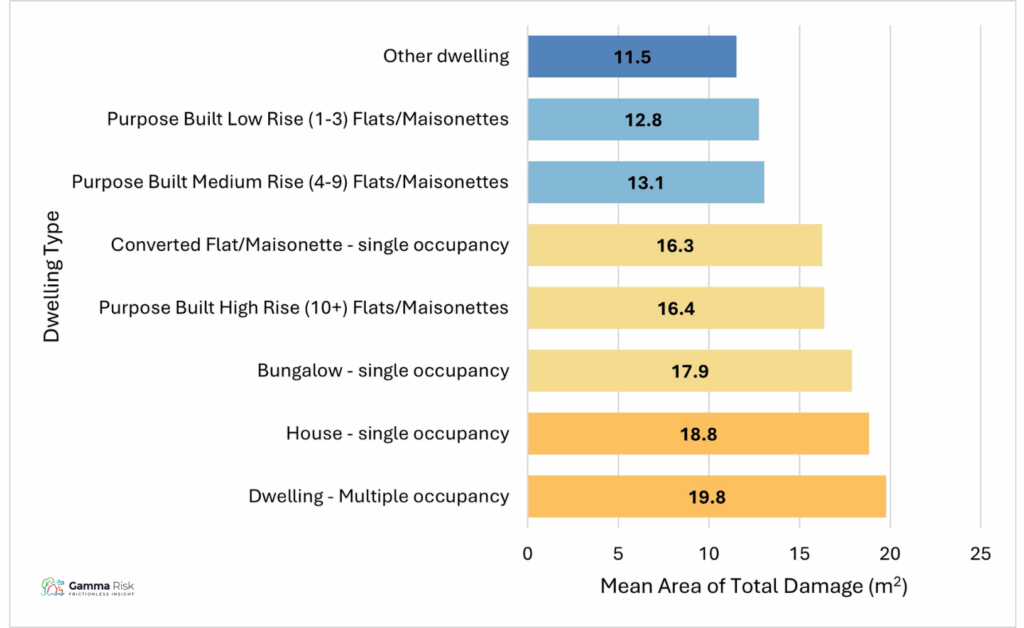
Chart 7: Damage by Dwelling Type in House Fires 2010/11 – 2024/25
Special Construction = Special Risk
Although rare (about 2% of cases), buildings with thatch or other special construction materials suffered far worse outcomes. Thatched dwellings averaged 79 square metres of damage – almost six times higher than average.

Chart 8: Total Damage in Special Construction Houses, 2017/18 – 2024/25
Occupancy is strongly protective. Permanently vacant buildings saw the highest damage, averaging 38 sqm, compared to just 14 sqm in occupied houses. Note that this was recorded for 220,873 dwelling fires from 2017/2018 onwards, when occupancy data became available.
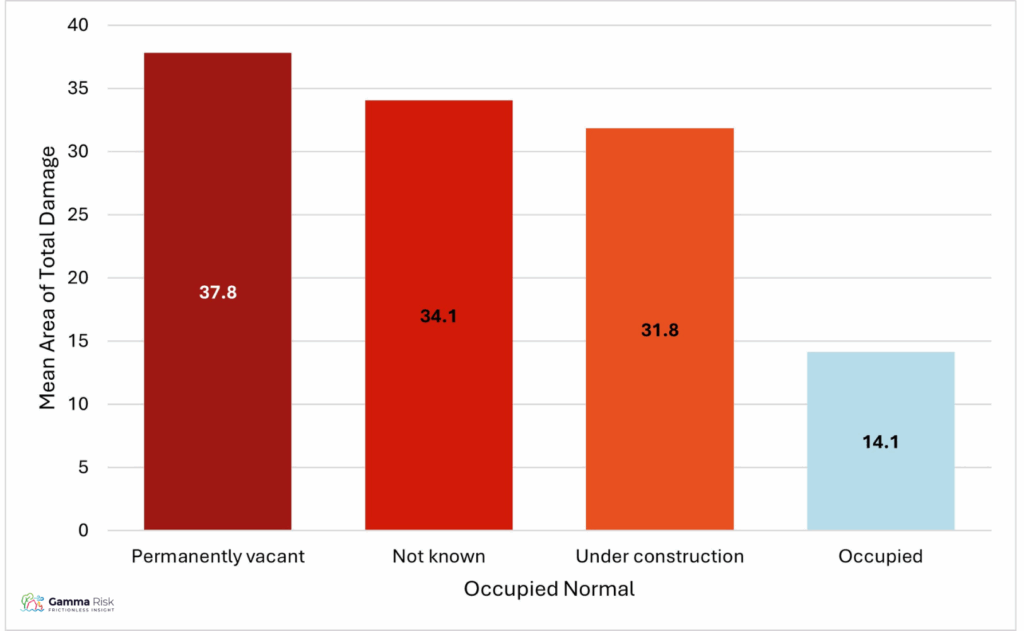
Chart 9: Occupancy Status and Total Damage in House Fires, 2017/18 – 2024/25
The Fire Alarm Factor
Fire alarms are the first line of defence, and their presence (and performance) makes a measurable difference. An alarm system was absent in 28% and present in 72% of home fires attended between 2010/11 and 2024/25.
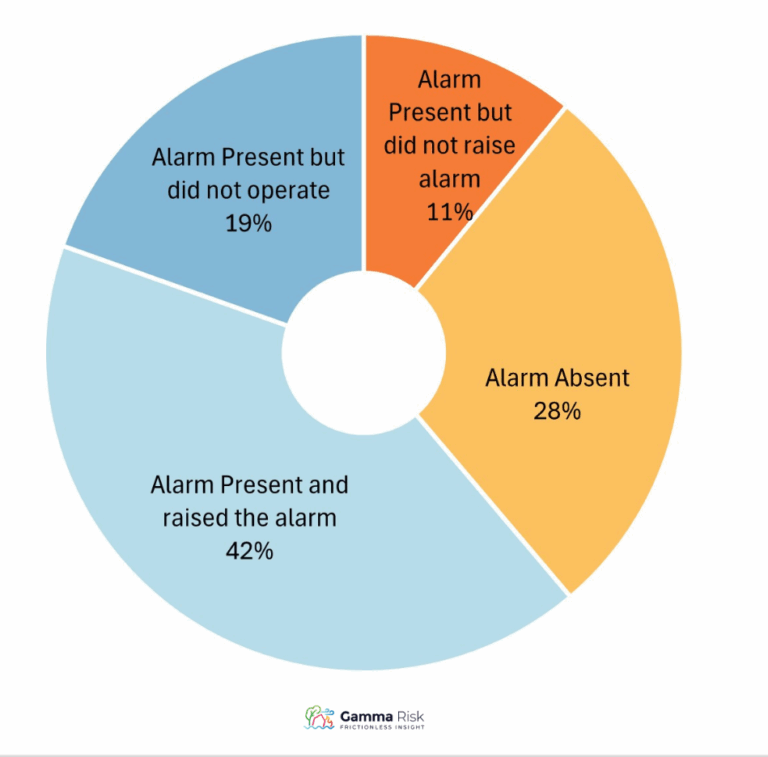
Chart 10: Presence of Fire Alarms in House Fires 2010/11 – 2024/25
Unsurprisingly, fires in homes without alarms resulted in 33% more damage compared to those where the fire alarm was present and functioned (19 square metres vs 14 square metres).
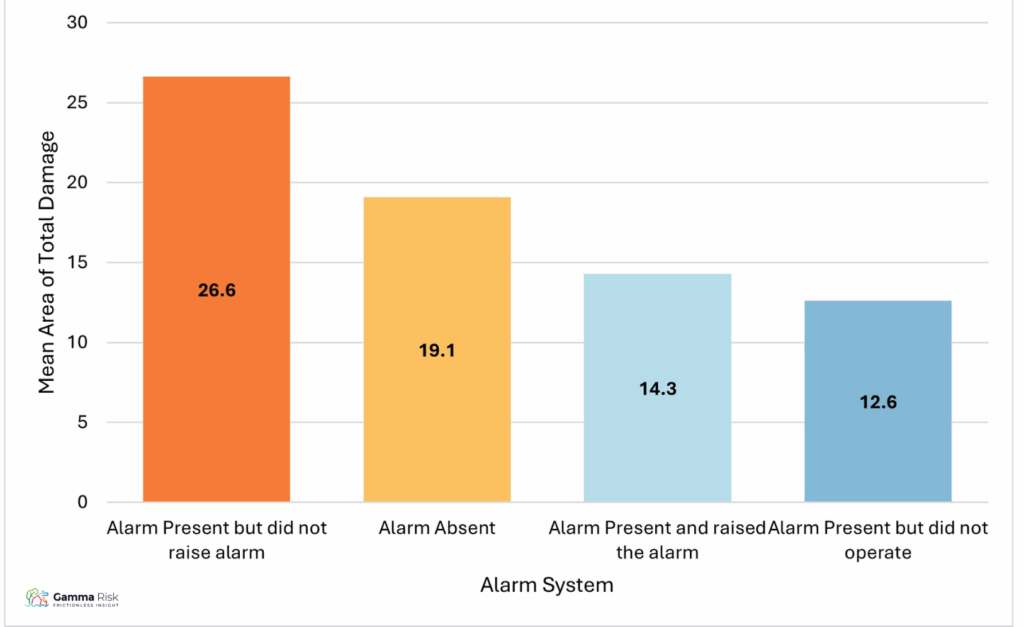
Chart 11: Total Damage in House Fires 2010/11 – 2024/25 by Alarm Presence
For the 220,723 fires recorded since 2017/18 where total damage was less than 1,000 square metres, 25% had no alarm present, 50% had a mains-powered alarm, 24% had a battery-powered alarm present, and for 1% the alarm type was other or not recorded. The pattern of alarm system operation differed between mains-powered and battery-powered alarms. Mains-powered alarms were more likely to raise the alarm (65% vs 47% of fires where they were present). Battery-powered alarms, when present, were more likely to fail to operate.
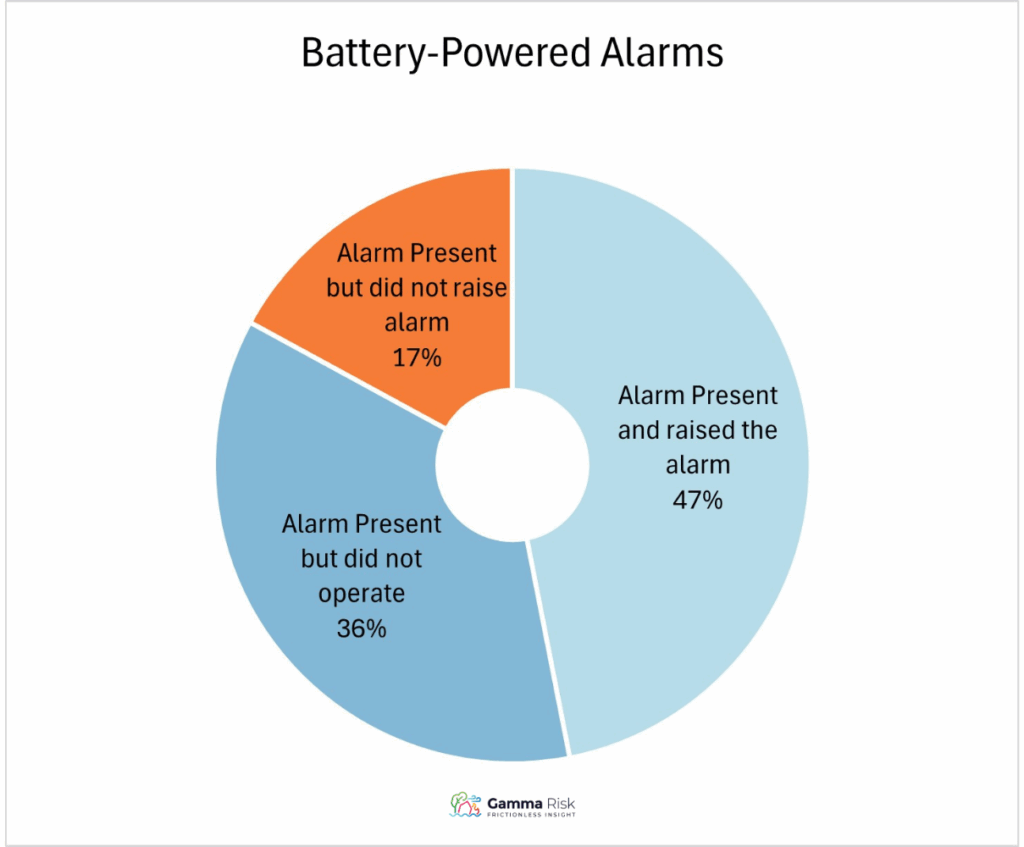
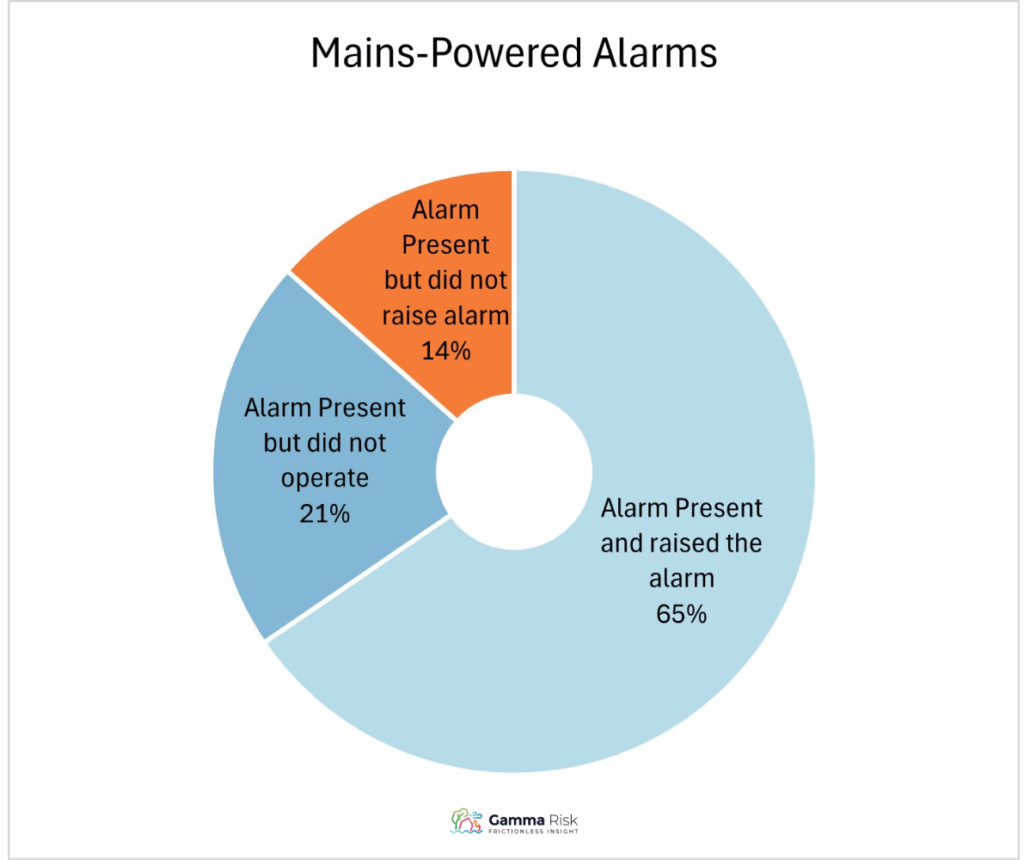
Chart 12 & 13: Functioning of Fire Alarms by Type, 2017/18 – 2024/25
Perhaps as a result of the greater reliability of mains-powered alarm systems, the average damage is greater in house fires where the alarm system is battery-powered than mains-powered, although either type of alarm is protective compared to no alarm.
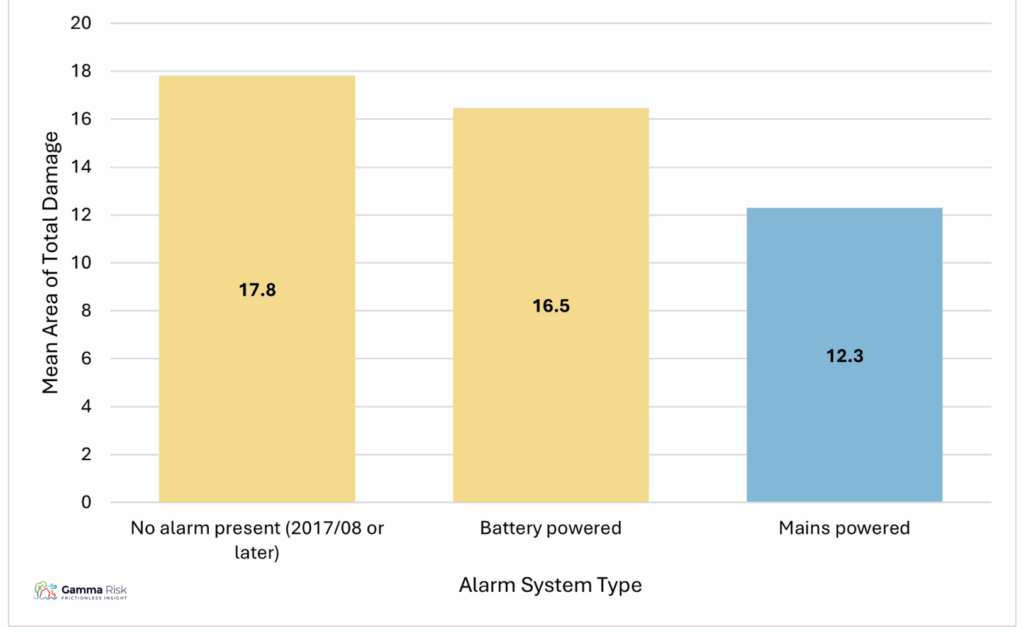
Chart 14: Damage in House Fires by Alarm Type, 2017/18 – 2024/25
Cause and Spread: Where and What Matters
Deliberate fires made up 11% of all cases and caused more damage (25 square metres on average) than accidental fires (16 square metres on average). Among accidental causes, “playing with fire” was the most destructive at 23 square metres, while misuse of appliances caused the least at 9.5 sqm.
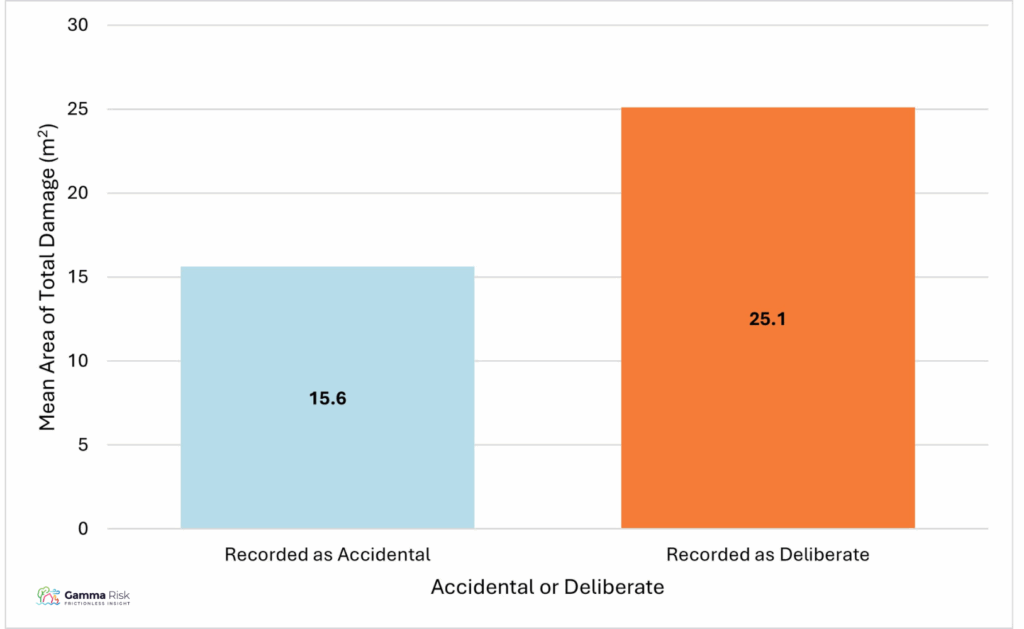
Chart 15: Average Total Damage by Cause of Fire in House Fires, 2010/11 – 2024/25
Fires starting in roof spaces averaged 44 square metres of damage, followed by bedrooms/bedsits (28.9 square metres) and garages (28.6 square metres). Although 53% of all home fires started in kitchens, these caused the least damage on average at only 10.8 square metres.
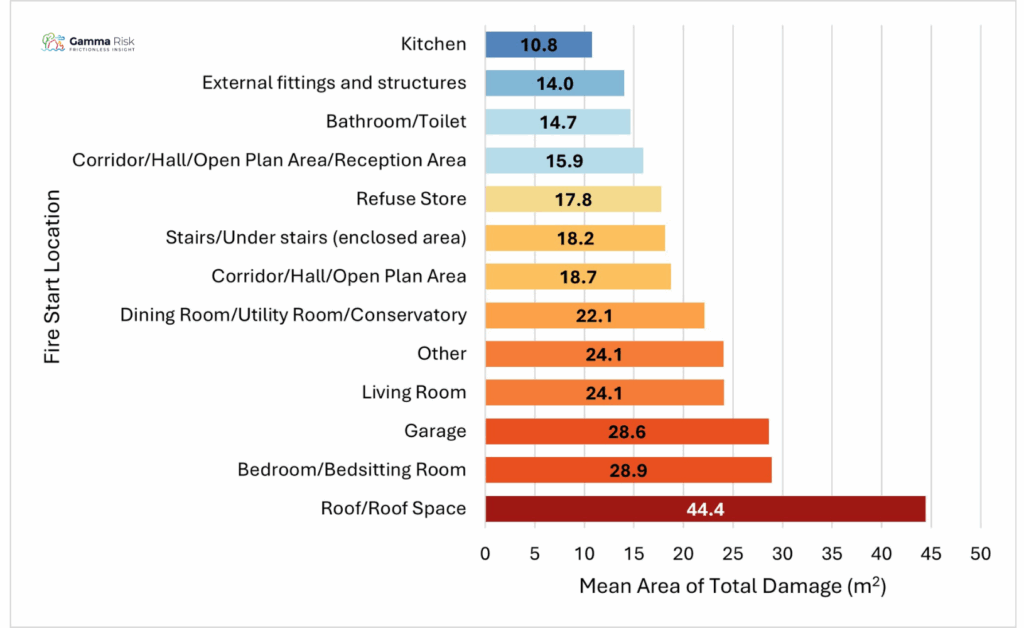
Chart 16: House Fire Start Location and Damage, 2010/11 – 2024/25
Food was the first item ignited in 29% of cases and the item causing spread in 22% of cases. However, home fires linked to food had the lowest average damage at just under 10 square metres. The largest damage on average resulted from fires involving furniture, which averaged 27.9 square metres when furniture was the first item ignited and 36.3 square metres when furniture was the item causing spread.
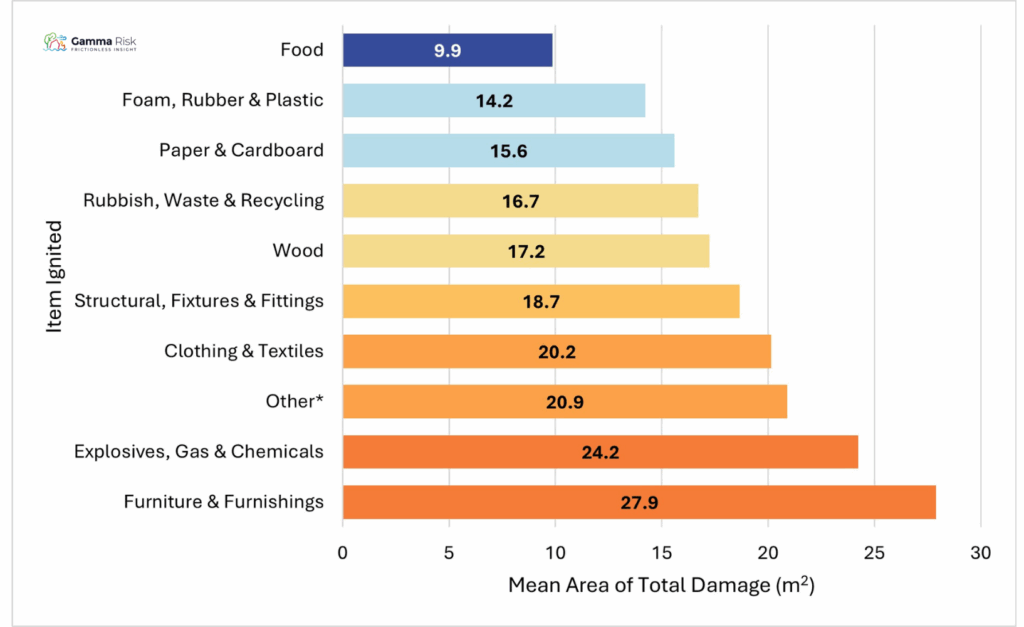
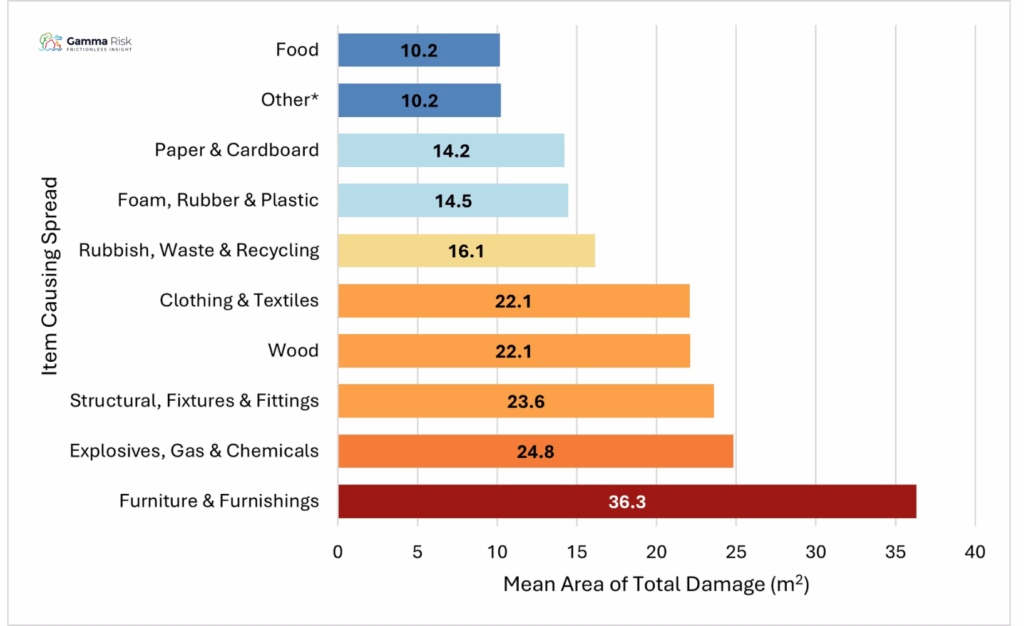
*Includes Not Known, Animal, Decoration, Celebration, Vegetation, & None
Chart 17 & 18: Total Damage by Item Ignited and Item Causing Spread, 2010/11 – 2024/25
Conclusion
This analysis shows that the most significant risk factors for house fire damage involve flammable materials and delays in detection or response.
Night-time incidents, vacant properties, and fires involving furniture or roof structures produced the greatest levels of damage. Fire alarms, particularly mains-powered systems, proved highly protective, though their effectiveness depends on proper installation and upkeep.
By continuing to analyse dwelling fire data over time, insurers, policymakers, and communities can better anticipate risks, target prevention strategies, and strengthen resilience against large-scale fire damage.


